RESOLV Futures Price Analysis: Surge Followed by Pullback — Opportunity or Trap?
Introduction to RESOLV Futures
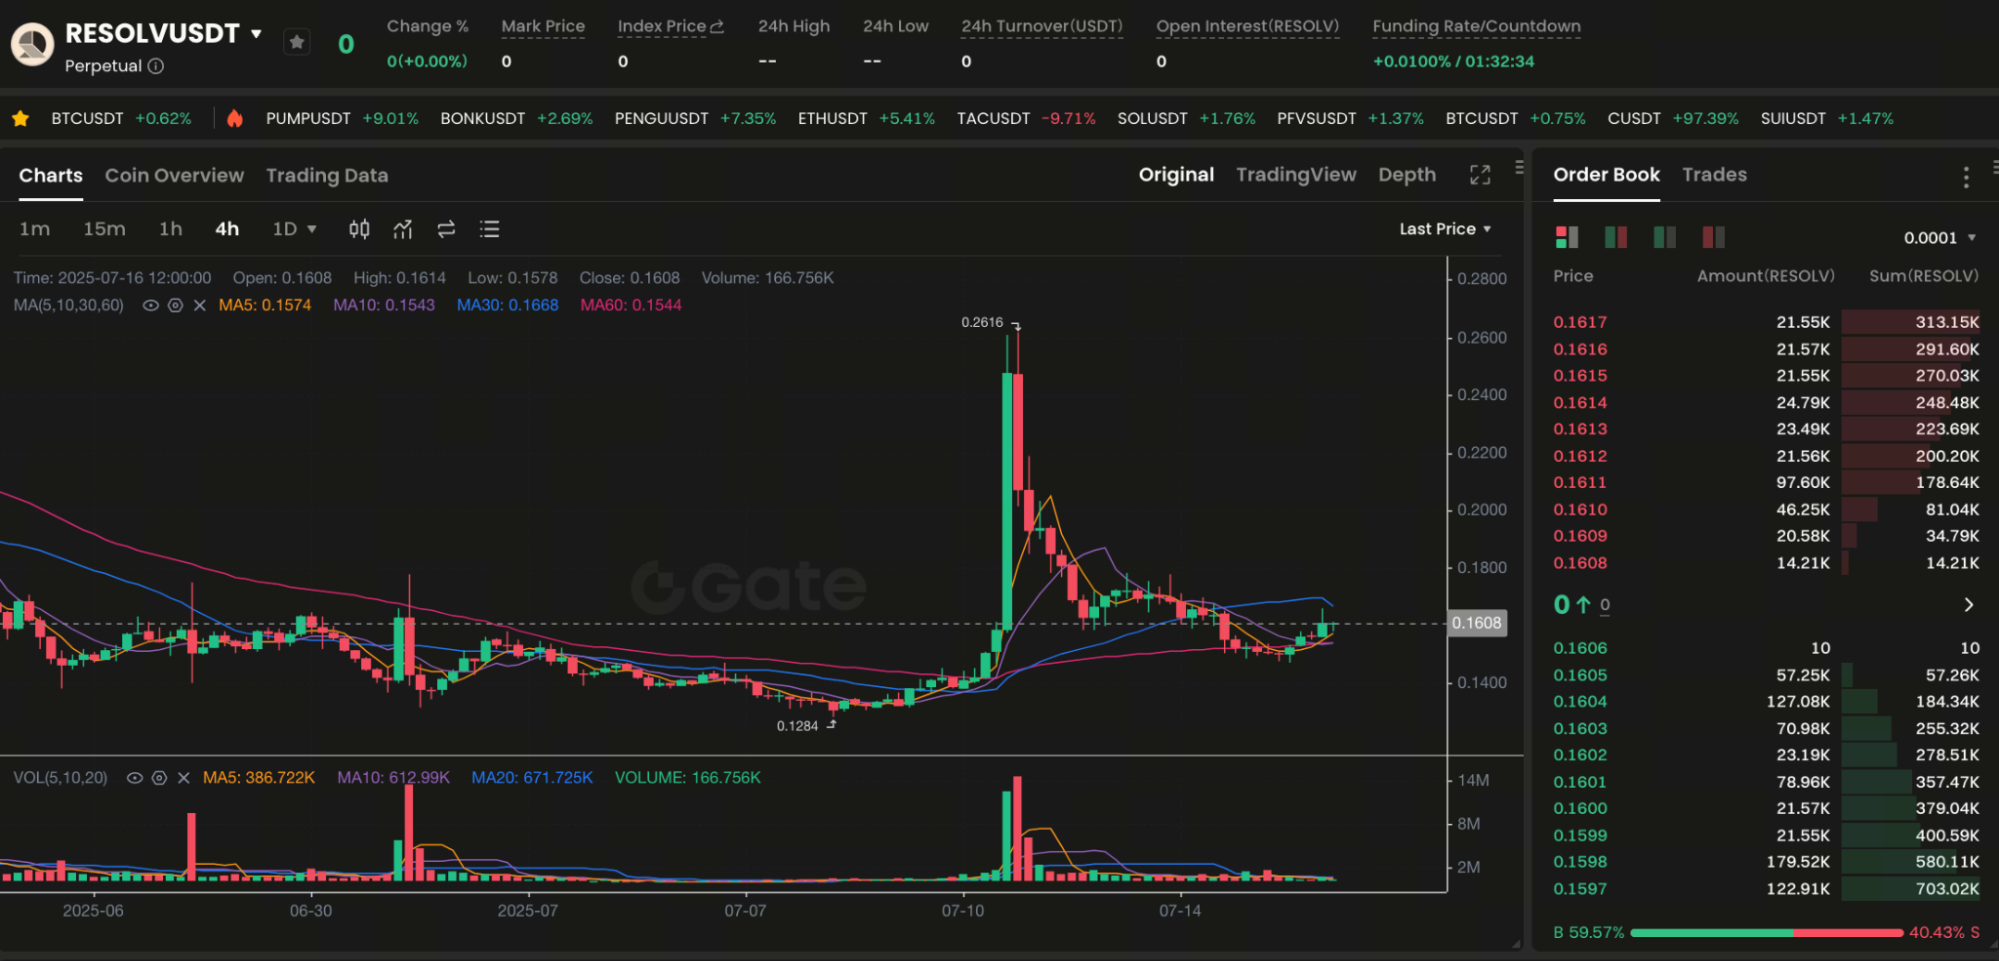
Image:https://www.gate.com/futures/USDT/RESOLV_USDT
RESOLV is a decentralized finance protocol that focuses on on-chain yield collaboration and redistribution mechanisms. Recently, it has gained attention due to the launch of its governance token RESOLV and perpetual contracts (Futures). RESOLV Futures is its derivative product launched on the Gate platform, designed to support leveraged trading, attracting significant short-term capital interest.
Latest Market Overview
According to the 4-hour K-line chart at 12:00 on July 16 from the Gate platform, the current price of RESOLV Futures is 0.1612 USDT, experiencing a big pump in just a few days:
- Lowest point: 0.1284 USDT
- Highest point: 0.2616 USDT
- Current consolidation range: 0.145 ~ 0.18 USDT
The trading volume experienced a breakout on July 10, and then gradually decreased, indicating that the market is gradually returning to rationality.
Big pump reason analysis
The short-term big pump of RESOLV Futures is mainly due to three factors:
- Contract trading launched: The opening of perpetual contracts brings a new round of leveraged capital injection into prices;
- Community传播效应:The community on platform X has driven retail investors to chase the rise in a short period.
- The market rotation sentiment is strong: recently, the MEME sector has experienced a pullback, with some funds shifting towards low market cap, high elasticity assets.
After the price broke through 0.20 USDT, some large holders chose to take profits and exit, triggering the subsequent waterfall pullback.
Pullback Trend Analysis
From the chart, it can be seen that the price has started to show multiple large bearish candles since the high of 0.2616 USDT, and it is currently fluctuating around 0.16 USDT. The main characteristics of this stage are:
- MA5 and MA10 dead cross, short-term trend under pressure;
- MA30 and MA60 have become support zones;
- The continuous shrinking of trading volume indicates a reduction in selling pressure, but buying interest has not strongly followed up.
Technically, it is in the natural pullback phase after a rise, and the market is still digesting the previous gains.
Market sentiment and capital flow
From the order book, the current bullish orders are stronger than the bearish ones, with buy orders concentrated in the range of 0.160~0.155, and the funding rate maintained at +0.01%, indicating that the main direction is still bullish.
In terms of funding sentiment, retail investors are largely in a wait-and-see stage, while institutions and high-frequency traders are building a range of fluctuations.
An Initial Exploration of Technical Indicators (Moving Averages and Trading Volume)
- MA5, MA10, MA30, MA60 moving average observation: Currently, the price is above MA10, initially breaking free from short-term pressure;
- The trading volume has明显萎缩: it is a consolidation signal, and it may also be a precursor to a “trend change”.
- Bollinger Bands are narrowing: the market may face a choice of direction, and investors are advised to closely monitor breakout situations.
Risks that investors need to pay attention to
Despite the strong performance of RESOLV Futures, the following risks should not be overlooked:
- High liquidity volatility can easily lead to slippage;
- High-leverage products are highly volatile, and positions should be controlled;
- Community news can easily lead to emotional trading, so be mindful of rational analysis.
- The contract position has no underlying delivery mechanism, and the volatility risk is greater than that of spot.
Market Outlook: Is it a short-term rebound or the start of a new round?
If RESOLV Futures can stabilize above 0.16 USDT and break through the MA30 moving average with increased volume, it may establish a secondary rise structure; conversely, if it falls below 0.145 USDT, it will return to the previous oscillation range.
Investors are advised to pay attention to the following two key signals:
- Breakthrough 0.18 USDT with increased volume, consider going long;
- Break below 0.145 USDT, stop loss or avoid high leverage operations.
Share
Content
Introduction to RESOLV Futures
Latest Market Overview
Analysis of the reasons for the big pump
Pullback trend analysis
Market sentiment and liquidity
An Introduction to Technical Indicators (Moving Averages and Volume)
Risks that investors should be aware of
Market Outlook: Is it a short-term pullback or the start of a new round?
Related articles

Pi Coin Transaction Guide: How to Transfer to Gate.io

What is N2: An AI-Driven Layer 2 Solution

Crypto Trends in 2025

Grok AI, GrokCoin & Grok: the Hype and Reality

What is Official Elon Coin (ELON)?
